NOAA Chart Offsets – Has this happened to you?
Date Posted: December 2, 2022
Source: Bob Sherer (aka Bob423), Contributing Editor

Have you ever been in the middle of a channel and found yourself aground? That happened on 11/23/2022 to Eric headed south on the ICW just north of Coinjock, North Carolina. Here's what he saw on his chartplotter running Navionics' "Nautical Chart" option:
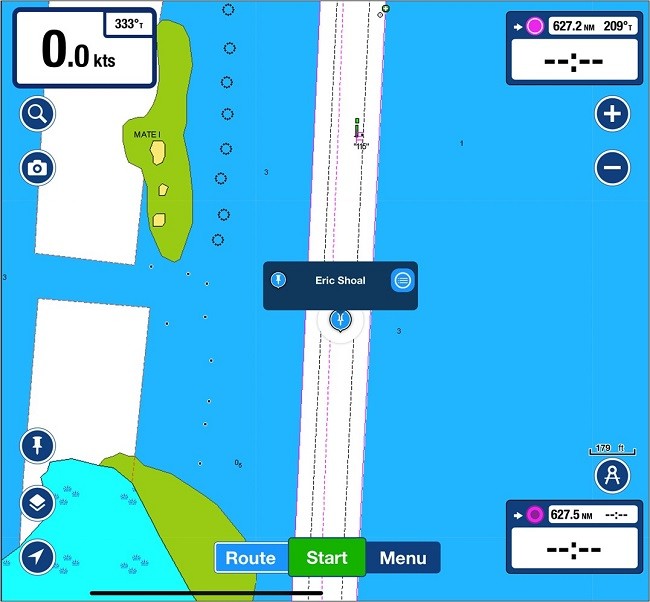
Figure 1 Location of Eric's grounding shown on Navionics' "Nautical Chart"

Eric reasonably thought a new shoal had suddenly appeared as his boat came to a halt. How can this be? He's directly centered in the channel! It's a well-traveled route with dozens of boats passing through the area daily who did not report a shoal. Puzzled, Eric dutifully reported the new shoal to the ICW Cruising Guide site (17,800 members) so others could avoid the danger. He helpfully provided the latitude and longitude of his grounding which is shown in Fig 1.

I saw his posting and formed the waypoint "Eric Shoal" shown in Fig 1. Let's see where that waypoint is displayed in Aqua Map with the USACE survey overlay.
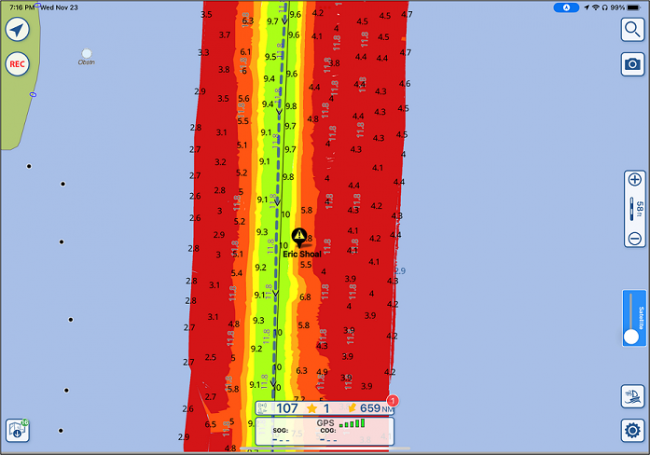
Figure 2 "Eric Shoal" as shown in Aqua Map with USACE survey overlay. The blue dotted line is the Bob423 Track

"Eric Shoal" is now shown on the edge of the channel and into the shallows. Why do the two charts show the grounding to be in different locations? The Navionics chart is derived from the base NOAA chart but the Aqua Map USACE survey is referenced to lat/long based on GPS, the WGS Datum. Some older NOAA charts are referenced to lat/long too but from pre-GPS techniques such as visual sightings, shore features, etc. There can be differences in location as you see in this example. Specifically, each depth reading in a USACE survey is tied to a GPS location, there will not be an offset since GPS positioning was used in the survey, the same GPS location data used by the navigation program or app to plot your location. 

Navionics SonarChart also uses GPS positioning for plotting depth contours. Let's take a look at the same "Eric Shoal" on SonarChart. 
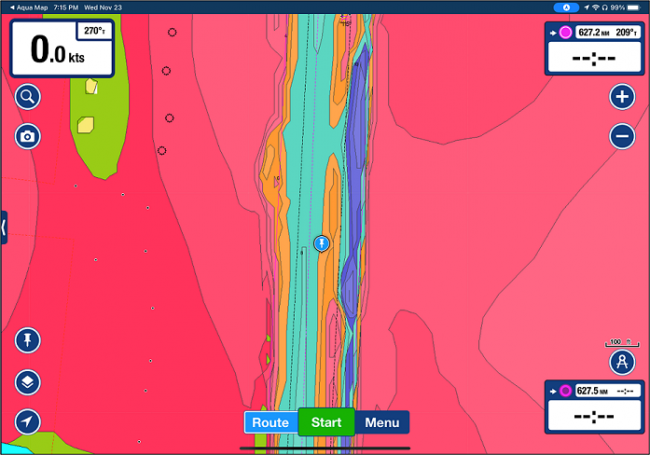
Figure 3 "Eric Shoal" shown in Navionics SonarChart

Navionics SonarChart also shows "Eric Shoal" on the side of the channel towards a shoal. Like USACE surveys, the depth contours in SonarChart are tied to GPS lat/long coordinates, there is no offset. Aqua Map can display the base NOAA chart without the USACE survey overlay, let's take a look.
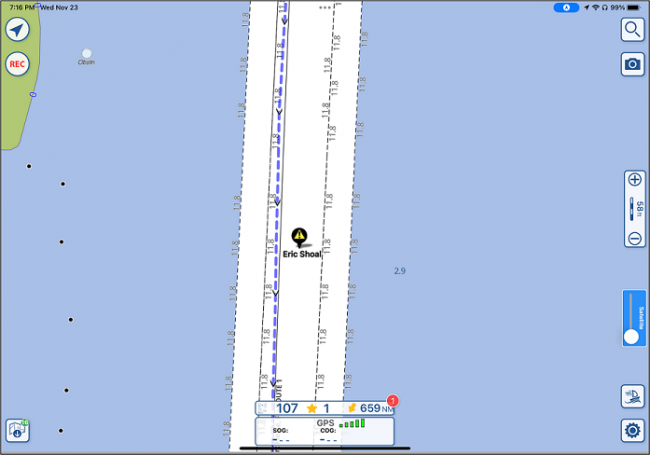
Figure 4 "Eric Shoal" shown on the NOAA chart in Aqua Map

You can see that the "Eric Shoal" is shown neatly centered in the NOAA chart channel. No wonder Eric was surprised when he came to a sudden stop. The blue dotted line is the Bob423 track for the area that is centered in the real channel per the USACE surveys. You can see that it's located to the west of "Eric Shoal" and is not centered in the NOAA chart channel.

What's the takeaway here? When traveling the ICW, one should always use Aqua Map with the USACE survey overlays that are referenced to the same GPS datum used by your navigation devices. With that setup, there will be no offset. Additional aids are the four Bob423 tracks that follow the deepest water on the ICW from Norfolk, Virginia to Ft Lauderdale, Florida. It's the blue dotted line shown in Fig 4. They are available for free downloading at: https://bobicw.blogspot.com

As a backup, use Navionics SonarChart when a USACE survey is not available. SonarChart is also referenced to the same GPS datum as the GPS on your boat. NOAA is improving its charts all the time and, in most places, uses the same datum as your GPS receiver but not everywhere. After all, who wants the "learning experience" of a grounding?

Stay Safe – Bob423

Comment Submitted by Mark Green - March 27, 2023

Thanks for the information, Bob. Whenever I switch over to the Navionics Sonar chart on my Raymarine chart plotter, I'm faced with a "Not for Navigation" warning. Do you know why they have this warning and what the deficiency of the Sonar charts might be?

Editor's Note: Almost all navigation platforms, including NOAA charts, include the "Not for Navigation", or "Not to be Used for Navigation" disclaimer in their charts, maps, digital offerings, etc. The underlying concept is that piloting a vessel is the responsibility of the skipper, who must employ various and numerous resources to arrive at safe transit of any waterway. We are to never depend solely on one source for navigation advice. There may be more concise explanations, but this is the baseline reason for why all publishers of charts and guidebooks include a disclaimer. As well as to protect from uninformed and inexperienced persons who believe someone else is to blame for their lack of experience and/or mistakes. Specific to Sonar charts, it's accepted knowledge that the contours on the sonar charts are not all mapped, sounded, or charted lines. The contours are drawn between depths that have been sounded. The space between the depths may not be as shown. And, depths are always subject to change, as are conditions in and along all waterways.
Comment Submitted by Tate Westbrook - March 23, 2023

I would caution members against blindly trusting the USACE surveys when they are really old, especially in areas of frequent shoaling, near ocean inlets, or areas near a river. Choose no older than 1.5 years option in the USACE survey display. How to do that: In the Aqua Map app, in Settings, under the "exclusive US data" is where you find the option to enable/disable the "USACE surveys". Once you enable the overlay, click on the small font "settings" just to the right of the USACE surveys blue toggle switch. In that submenu select the max age of the survey. You may choose from All / 3 yr / 1.5 yr / months. I recommend NEVER rely on the "ALL" or the "3 yr" data. Those surveys are just way too old--lots of movement in the bottom can occur in 3 years. Even showing survey data 1.5 years old or newer has inherent risk, but if you do use this overlay, I recommend only using the 1.5 yr setting, or to be most conservative, go into the months setting and enter "12" so you know you have only very fresh survey data displayed. Toggling back and forth between 1.5 yr and 12 months gives you confidence that the data is fresh.

Comment Submitted by Bob423 - December 5, 2022

Robert Norman, NOAA has improved the location accuracy of their charts over the past five years. There are many fewer places like the one in the article now but there are still there in spots. Aqua Map with USACE surveys and Navionics SonarChart match the GPS lat/long output by your GPS receiver - so it's always wise to have one or both running and treat the NOAA charts with caution when it comes to location sensitive areas. Another area with an even greater offset is Steamboat Creek, a popular anchorage south of Dawho River at MM 497, where following the NOAA chart can lead you into shallow water. Both Aqua Map with USACE surveys and SonarChart will show you the safe path.

Comment Submitted by Bob423 - December 5, 2022

Captain Gene of Galene, I agree with you on every point! The only observations I would add are: 1) The USACE surveys are usually run once per year from Norfolk to Hilton Head but less often south of there. Areas that shoal more frequently are surveyed more often such as Lockwoods Folly and Browns Inlet and others. There are areas of the ICW in that stretch that haven't changed in over a year, even with hurricanes - which do not affect ICW depths as one might expect per my study. The date of the survey is available in Aqua Map with a tap on the survey. 2) Navionics SonarChart is a great resource but must be used with caution in areas that shoal rapidly. In areas such as Lockwoods Folly and Browns Inlet, it can lead you directly into a shoal. In places where rapid shoaling occurred and a buoy was moved to direct boaters away from it, Navionics SonarChart never gets updated and in one place (by G65A at MM 244) shows 12 feet MLLW where boaters are enjoying a sandy beach. The reason here is that boaters have been diverted from updating the depths in that area by the buoy relocation - so SonarChart never gets new data and displays the old data. The areas shown in the example has not changed in years so SonarChart has had plenty of time to digest many boaters' soundings inputs.

Comment Submitted by Captain Gene Of Galene - December 5, 2022

Good article and examples thank you kindly. But the USACE surveys can be out of date by months or maybe a year or two. Unfortunately, after storms things sometimes change and a new survey needs to be redone again. I run Aqua maps with the surveys overlaid but I also run Navionics sonar on my other devices as the crowd sourced information is especially helpful to see the latest almost current conditions. The Navionics sonar information also covers areas that the surveys when off the channel the COE surveys do not cover. Between the two applications you have much better information to guide you than using only a government chart or your normal chart plotter without the updated information. If you use the shading options on the Navionics sonar it makes staying away from the shallow side of the channel straight forward and lowers the odds of running a ground. Of course, you need to update often to have the latest information, or the Navionics sonar chart is not the latest information just like the surveys are out of date. I update at least weekly to have the latest. When I used Charts in the old days you could do everything in the channel as on the chart but still run aground as the waterways are dynamic and not static as the charts. Change is always happening. Captain Gene Of Galene

Comment Submitted by Stefan Sobol - December 2, 2022

Pays to read the disclaimer that appears on your plotter screen each time you turn it on.

Comment Submitted by Robert J Norman - December 2, 2022

Hunh? I thought we had come a long way from the old British Admiralty survey charts but apparently not far enough. I find it hard to believe that any published charts today are not slaved to gps. How else can we make sense of it?

Explore More News & Articles In Specific Cruising Areas
Recent Videos
Plan Your Boating Adventures with Waterway Guide
Waterway Guide's new Mobile App on iPad Mini with maps, data links, and downloadable guide books
Fuel Prices for Boating at Waterwayguide.com
Purchase a Guide
  • 4,000 Marinas
  • Thousands of anchorages
  • Updated Charts
  • Mile-by-Mile Navigation
  • Highlighted Alerts & Cautions
  • Full-Color Aerial Photographs
Download The App

The Waterway Guide App Makes it easy to leave reviews, use our explorer, and view waterway guide materials all on the go!